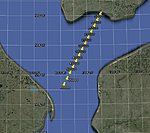
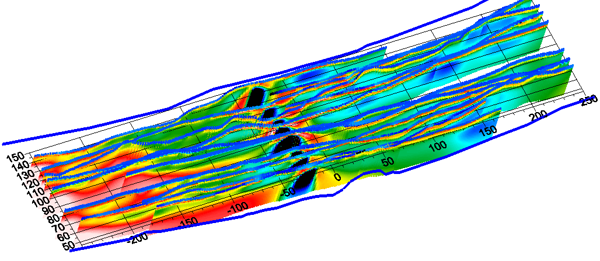
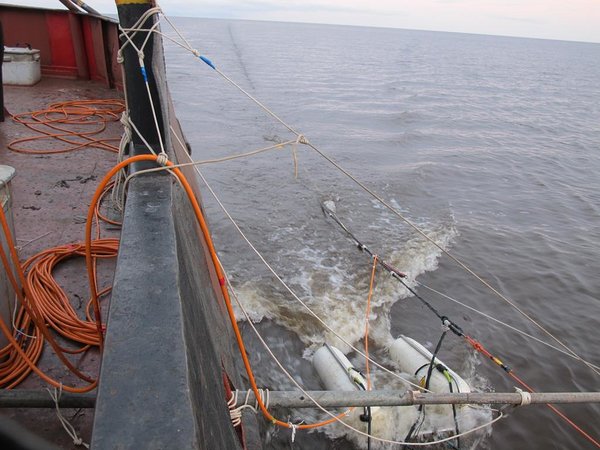
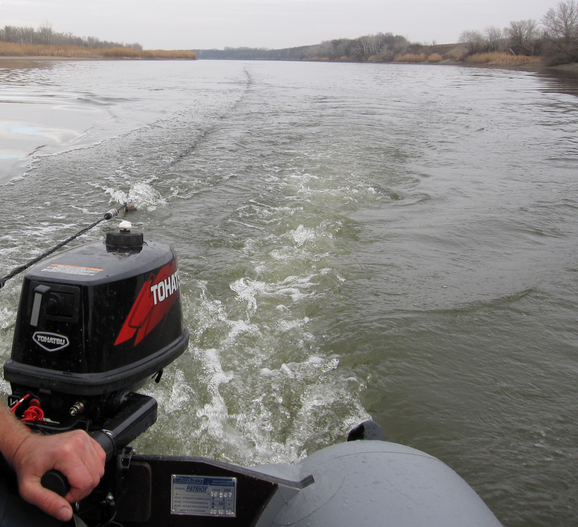
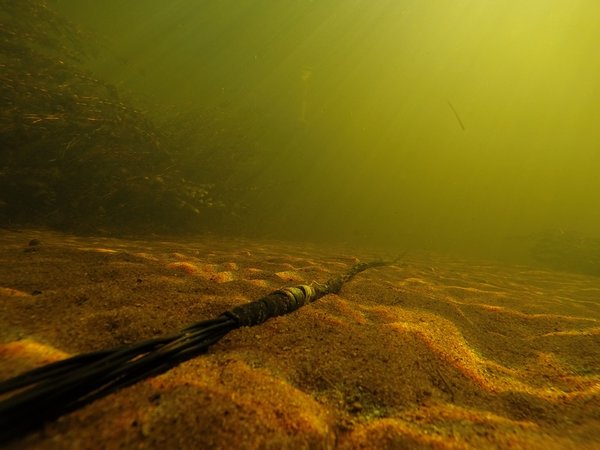
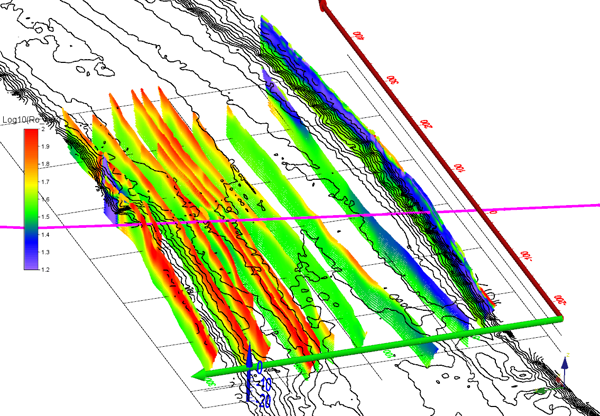
Electrical resistivity tomography can be used for continuous on-water observations. It requires to process large amount of data. For this type of ERT data a special version of x2ipi has been developed.
ersion

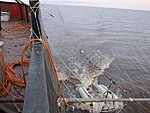
The accuracy of the continuous data is often lower in compare with normal ERT survey. Waves, wind and currents could disturb the data. Therefore, the x2ipi provides a filtration in-window for each electrode spacing.
Moreover, data export into ipi2win software for 1D VES interpretation is different from common version of x2ipi. This version does not export each possible VES curve, but only mean curves in sliding window.


Moreover, data export into ipi2win software for 1D VES interpretation is different from common version of x2ipi. This version does not export each possible VES curve, but only mean curves in sliding window.


Write first comment